This week I’ve been working with my students on graphing data. This is a process that has been humbling in the past. I often approach it as this should be a simple review for my students, after all they’re 7th graders! They should know what to do and understand what makes a good graph. Unfortunately the reality is most of them think every graph needs to be a bar graph and they have wildly varying ideas of what “good” means.
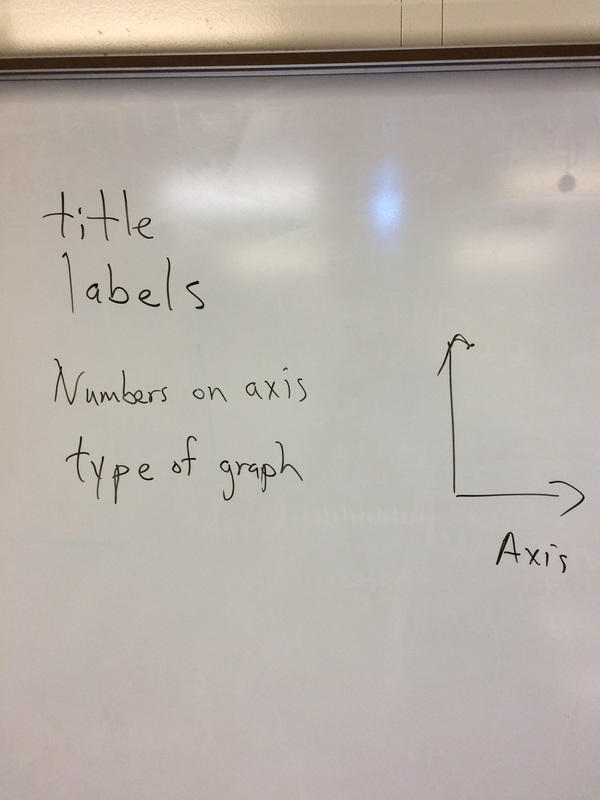
So this year I decided to approach graphing from a different angle. Instead of assuming they know what quality is, I asked them directly. I started class by sharing with them the target – “I can organize data to determine patterns or trends.”, and asking them what they thought this meant. Answers varied but generally fell into two camps: data charts or graphs. I next directed the conversation toward graphs by asking students to discuss in their groups what are qualities or criteria of a good graph. The list they came up with is shown in the first picture in the gallery below.
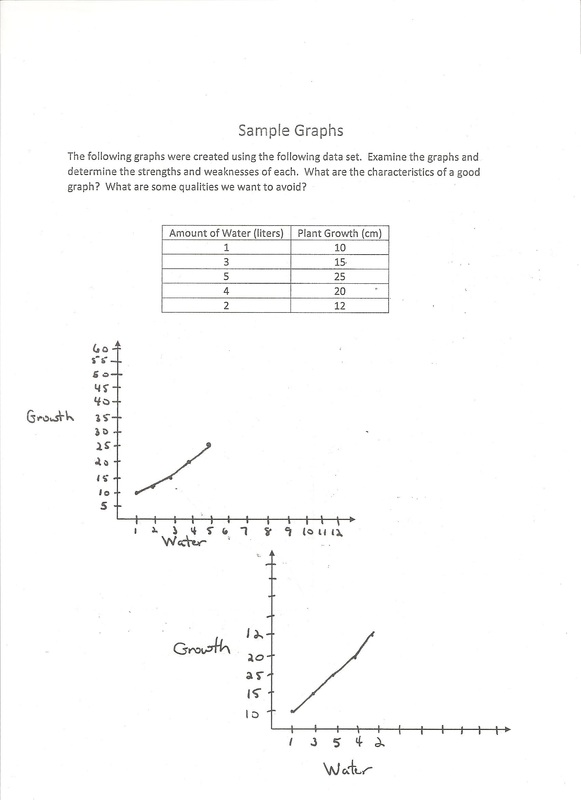
Next I gave them some sample graphs to examine. The graphs were all based on the same data. Each graph had strengths and weaknesses, and each graph emulated something students have had a problem with in the past. The second and third pictures in the gallery show the sample graphs I used.
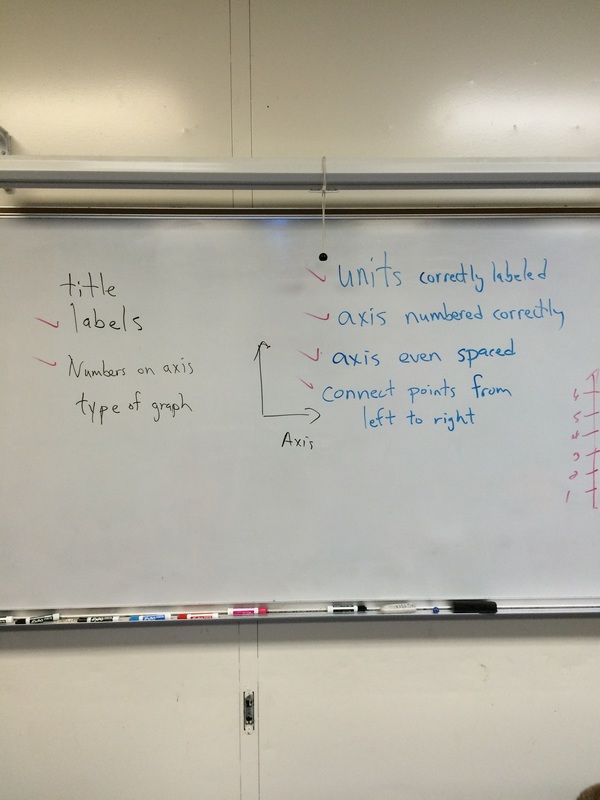
I asked students to look at the samples and use them to add to their list of graph criteria. After small group discussion and whole group sharing out, the fourth picture in the gallery shows the final list they came up with.
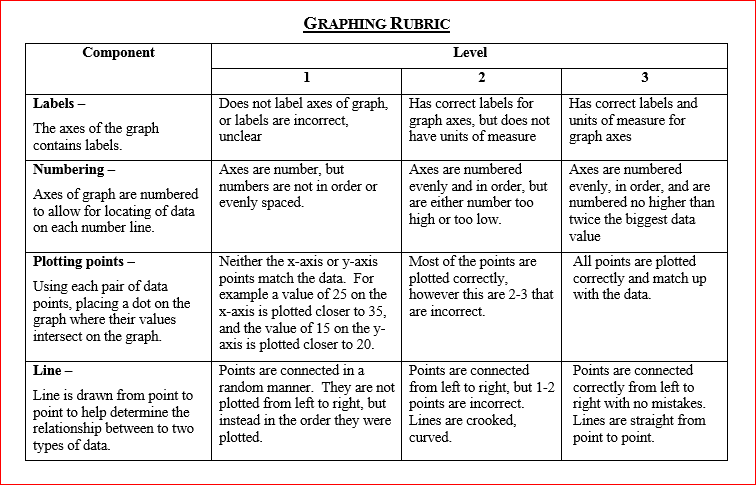
You can see they were able to add several criteria to their list. They used the sample graphs to help them identify graphing mistakes. I next told them I was passing out a rubric that experts in graphing came up with. They compared the rubric to what their list contained and found that they had hit on most of the qualities of a good graph. This lets kids see that as a whole they know a great deal about the criteria for a graph.
After this I had students collect some data and graph it. While their graphs weren’t perfect, the majority of students had hit the successful criteria for their graph.
The outcome from this strategy is two-fold. First my students are more cognizant of graph criteria than before. It is now at the forefront of their minds and they are actively thinking about the criteria when constructing graphs. Second, we now have a common language upon which to provide and act on feedback.
In the end I still had students struggle with their graphs, but the number was smaller than previously. Leveraging students’ understandings of quality, along with samples of varying quality, helped me make explicit to them what target they were aiming for. And students can hit any target that is clear and holds still for them – [borrowed from Rick Stiggins].
So this year I decided to approach graphing from a different angle. Instead of assuming they know what quality is, I asked them directly. I started class by sharing with them the target – “I can organize data to determine patterns or trends.”, and asking them what they thought this meant. Answers varied but generally fell into two camps: data charts or graphs. I next directed the conversation toward graphs by asking students to discuss in their groups what are qualities or criteria of a good graph. The list they came up with is shown in the first picture in the gallery below.
Next I gave them some sample graphs to examine. The graphs were all based on the same data. Each graph had strengths and weaknesses, and each graph emulated something students have had a problem with in the past. The second and third pictures in the gallery show the sample graphs I used.
I asked students to look at the samples and use them to add to their list of graph criteria. After small group discussion and whole group sharing out, the fourth picture in the gallery shows the final list they came up with.
You can see they were able to add several criteria to their list. They used the sample graphs to help them identify graphing mistakes. I next told them I was passing out a rubric that experts in graphing came up with. They compared the rubric to what their list contained and found that they had hit on most of the qualities of a good graph. This lets kids see that as a whole they know a great deal about the criteria for a graph.
After this I had students collect some data and graph it. While their graphs weren’t perfect, the majority of students had hit the successful criteria for their graph.
The outcome from this strategy is two-fold. First my students are more cognizant of graph criteria than before. It is now at the forefront of their minds and they are actively thinking about the criteria when constructing graphs. Second, we now have a common language upon which to provide and act on feedback.
In the end I still had students struggle with their graphs, but the number was smaller than previously. Leveraging students’ understandings of quality, along with samples of varying quality, helped me make explicit to them what target they were aiming for. And students can hit any target that is clear and holds still for them – [borrowed from Rick Stiggins].

 RSS Feed
